Best TradingView Indicator for Bitcoin (2026)
Bitcoin trades 24/7, moves in violent bursts and punishes late entries. The best indicator for it is not the one with the most signals — it's the one that tells you before the burst that pressure is building, and where the move is likely to stop.
The short version: For Bitcoin, look for three things in one place: volatility compression (BTC coils before every big leg), divergence (momentum disagreeing with price at the extremes) and clear levels to aim at. The ILT® suite combines all three and prints the Diamond when they line up — and every major BTC call is posted live on X.
What makes an indicator good for Bitcoin
- It must handle volatility cycles. BTC alternates long quiet ranges with explosive expansions. An indicator that only follows trend will be late on every expansion; you need one that measures the squeeze itself.
- It must work on weekends and on any timeframe. Many of Bitcoin's sharpest moves start on a Sunday night. Alerts that run on TradingView's servers, on any timeframe from 15 minutes to weekly, matter more here than on stocks.
- It must read exhaustion, not just direction. Bitcoin tops and bottoms are usually marked by momentum fading while price makes a new extreme — classic divergence. A good BTC tool spots that automatically.
- It must not drown you in signals. Crypto charts are noisy. Ten oscillators that disagree are worse than one clear read.
Free tools worth keeping
Free tools still earn a place on a Bitcoin chart: RSI with divergence for exhaustion, Bollinger Band width to see the squeeze, volume profile for the levels where BTC traded most, and the 200-day average for the cycle backdrop. The problem is not that they don't work — it's that you have to watch them all, all the time, and decide when they agree.
How the ILT® suite reads Bitcoin
The ILT® suite does that watching for you. It measures volatility compression on the chart you're on, checks momentum for divergence at the extremes, and draws the support/resistance zones and trendlines automatically. Bull / Bear labels mark structure turns (and H Bull / H Bear the hidden divergences inside a trend). When compression and confluence line up, the Diamond prints — the single signal that a large move is building.
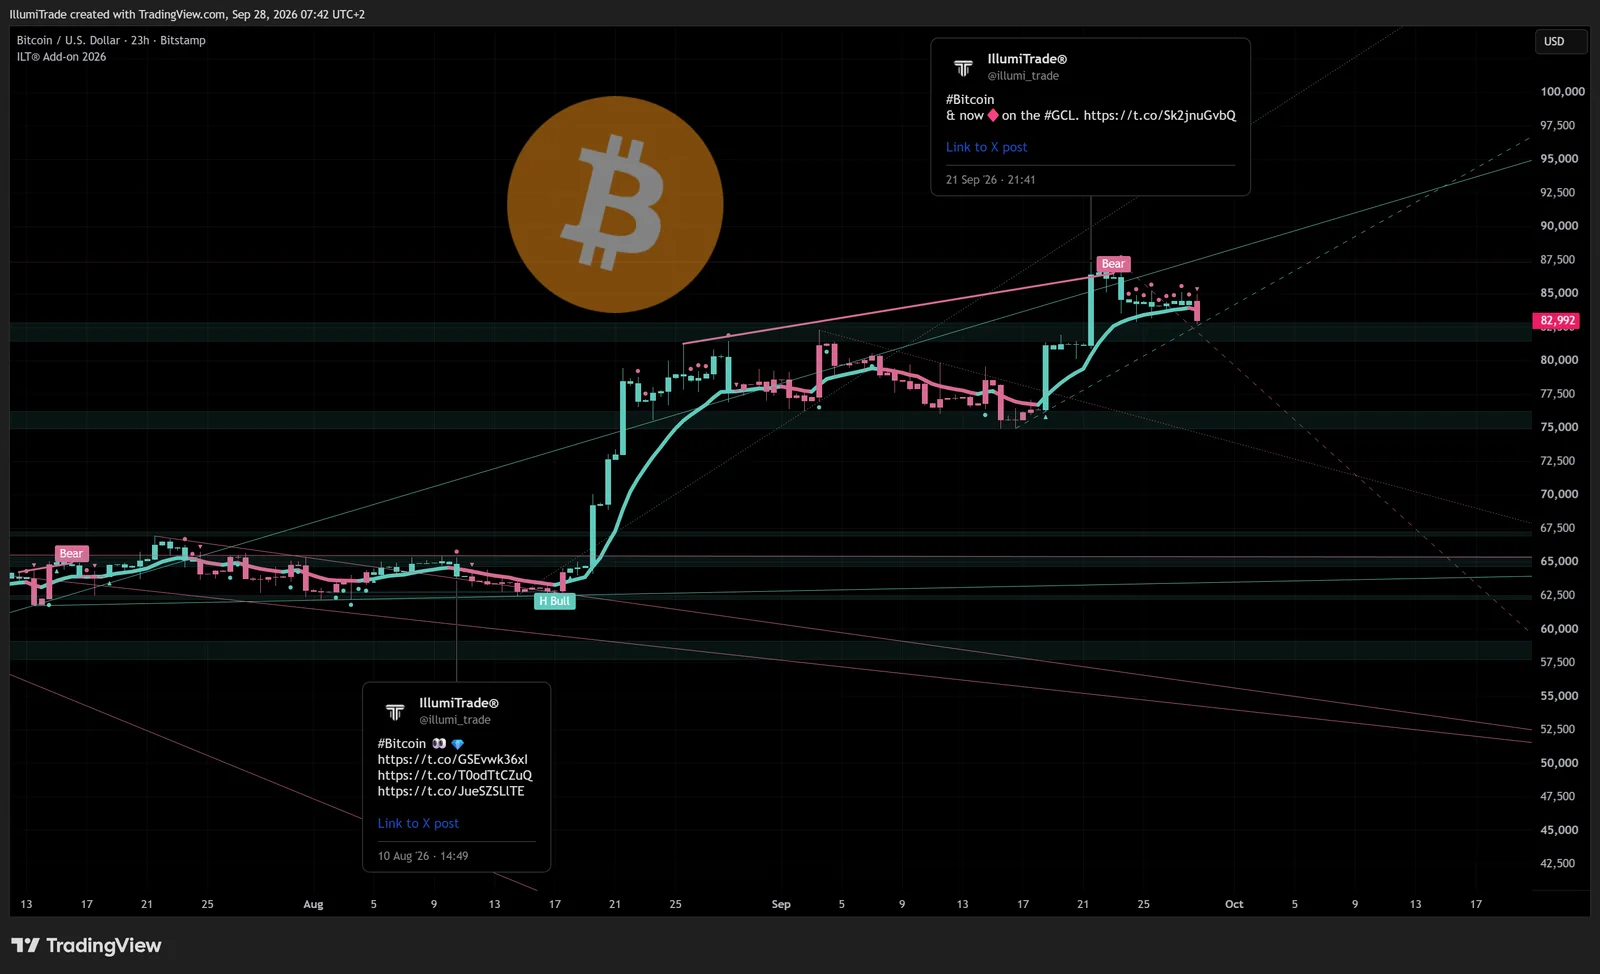
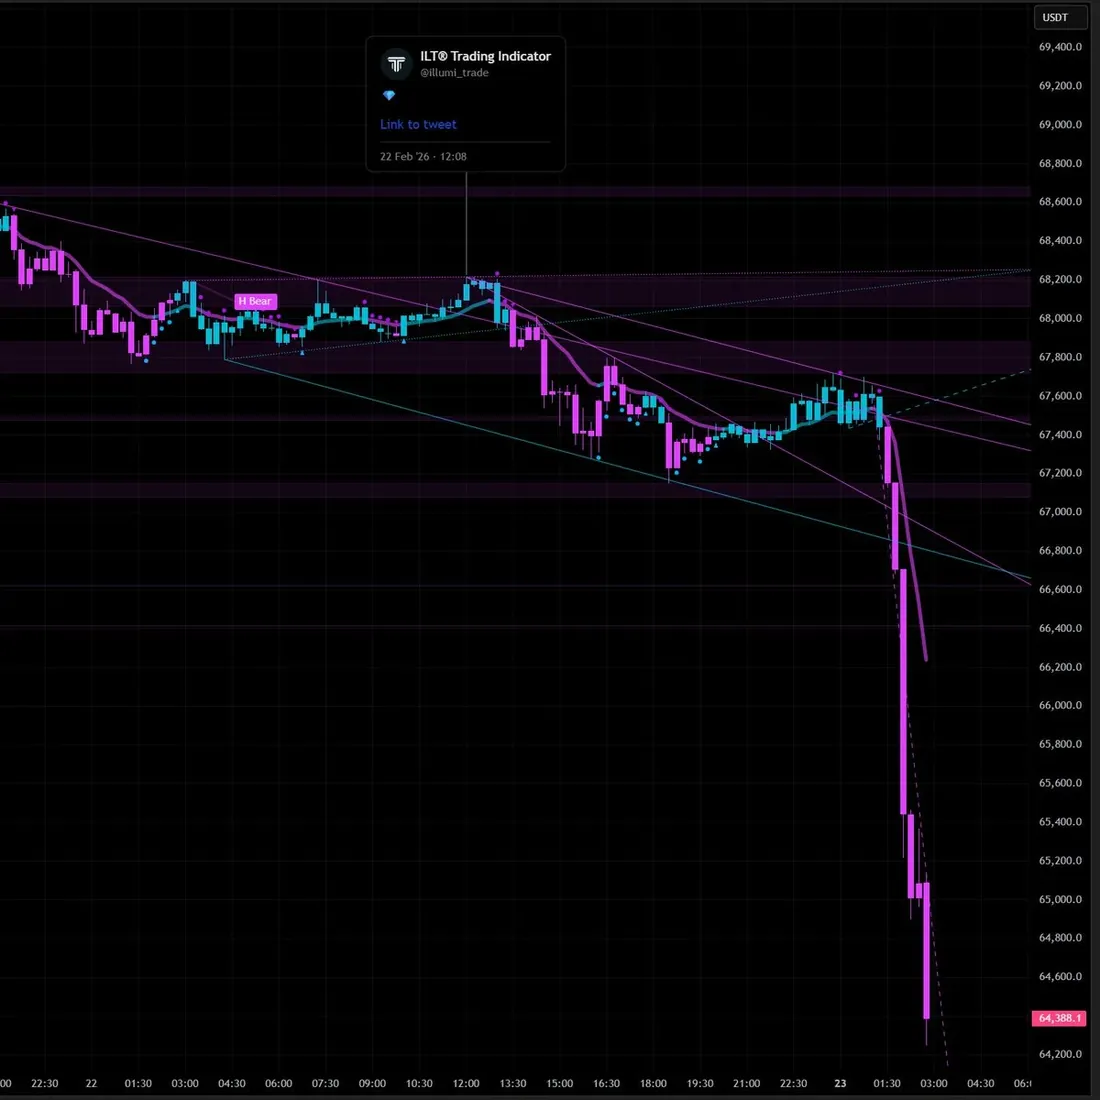
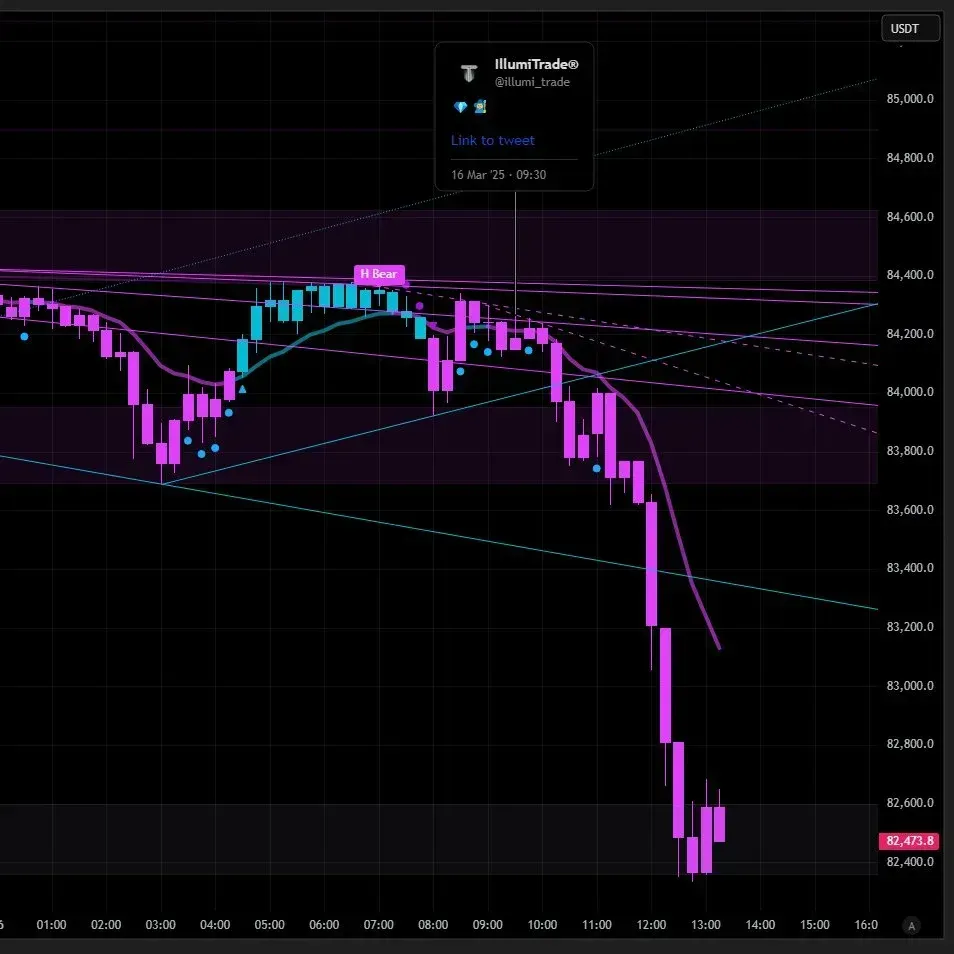
These are public calls, posted on X (@illumi_trade) with their timestamps — 300+ calls across 200+ markets. You can scroll back and check every one before you pay anything.
A simple Bitcoin workflow with ILT®
- Start on the daily chart: is Bitcoin compressed, or already expanding? A Diamond after a long squeeze carries more weight than one in the middle of a trend.
- Drop to the 4-hour chart for timing. Look for a Bull or Bear label at one of the auto-drawn zones.
- Check for divergence at the extreme — the suite labels it for you.
- Set an alert on the Diamond so you don't have to watch the chart at 3 a.m.
- Size the trade to the zone: the nearest opposite zone is your first objective, the zone you entered from is your line in the sand.
The macro side: for a daily, plain-English read on where Bitcoin lean over the next month, see our sister desk, ILT Oracle: Bitcoin price prediction — next-month odds, updated daily →
See the Diamond on your own Bitcoin charts
7 days free. Add your TradingView username, get access within hours, cancel in 1 click. The free TradingView plan is enough.
Start 7-Day Free Trial →Trading involves substantial risk of loss. Nothing on this page is investment advice. Public calls are shown as examples of how the suite reads a chart; past calls do not guarantee future results.
FAQ
What is the best indicator for Bitcoin on TradingView?
The best Bitcoin indicator combines volatility compression, divergence and clear levels, because BTC moves in quiet coils followed by violent expansions. Free tools like RSI divergence and Bollinger Band width cover parts of this; the ILT® suite combines them into one signal, the Diamond, and posts its Bitcoin calls publicly on X.
What timeframe is best for Bitcoin indicators?
Use the daily chart for context (is BTC compressed or trending?) and the 4-hour chart for timing. Lower timeframes work, but signals on them carry less weight and need the higher timeframe to agree.
Does the ILT suite work on altcoins too?
Yes. It runs on any TradingView chart — Bitcoin, Ethereum, altcoins, crypto indices like TOTAL and TOTAL3, and even stablecoin supply charts.