Best TradingView Indicator for Gold (XAUUSD) in 2026
Gold trends for months, then turns hard. Most traders catch the middle of the trend and give it back at the turn. The indicator you want on XAUUSD is one that respects the trend but warns you when the turn is building.
The short version: For gold, combine trend structure (gold respects it more than most markets), divergence at the highs and lows, and clear zones. The ILT® suite marks all three and printed the signals at the August 2026 gold top near $4,650 before the drop to $4,180 — posted live on X.
What makes an indicator good for gold
- It must respect long trends. Gold can grind higher for months. Indicators that call a top on every overbought reading will have you fighting the trend.
- It must catch exhaustion at the extremes. Gold's major tops usually show momentum fading while price prints one last high — divergence a good tool should label automatically.
- It must react to macro shocks. Rate decisions, dollar moves and geopolitics hit gold in minutes. Zones and alerts matter more than constant screen-watching.
- It must work across timeframes. Swing traders live on the 4-hour and daily; scalpers on the 15-minute. The read should be consistent across all of them.
Free tools worth keeping
Free tools that help on gold: the RSI (for divergence at the highs), volume profile for the price areas gold traded most, and a dollar index (DXY) chart side by side — gold often moves against the dollar.
How the ILT® suite reads gold
The ILT® suite reads gold the same way on every timeframe: Bull / Bear structure labels, H Bull / H Bear for hidden divergences inside a trend, auto-drawn zones and trendlines, and the Diamond when compression and confluence line up. On the August 2026 top, the Bear label printed at the high and the move that followed ran down through the zones the suite had drawn.
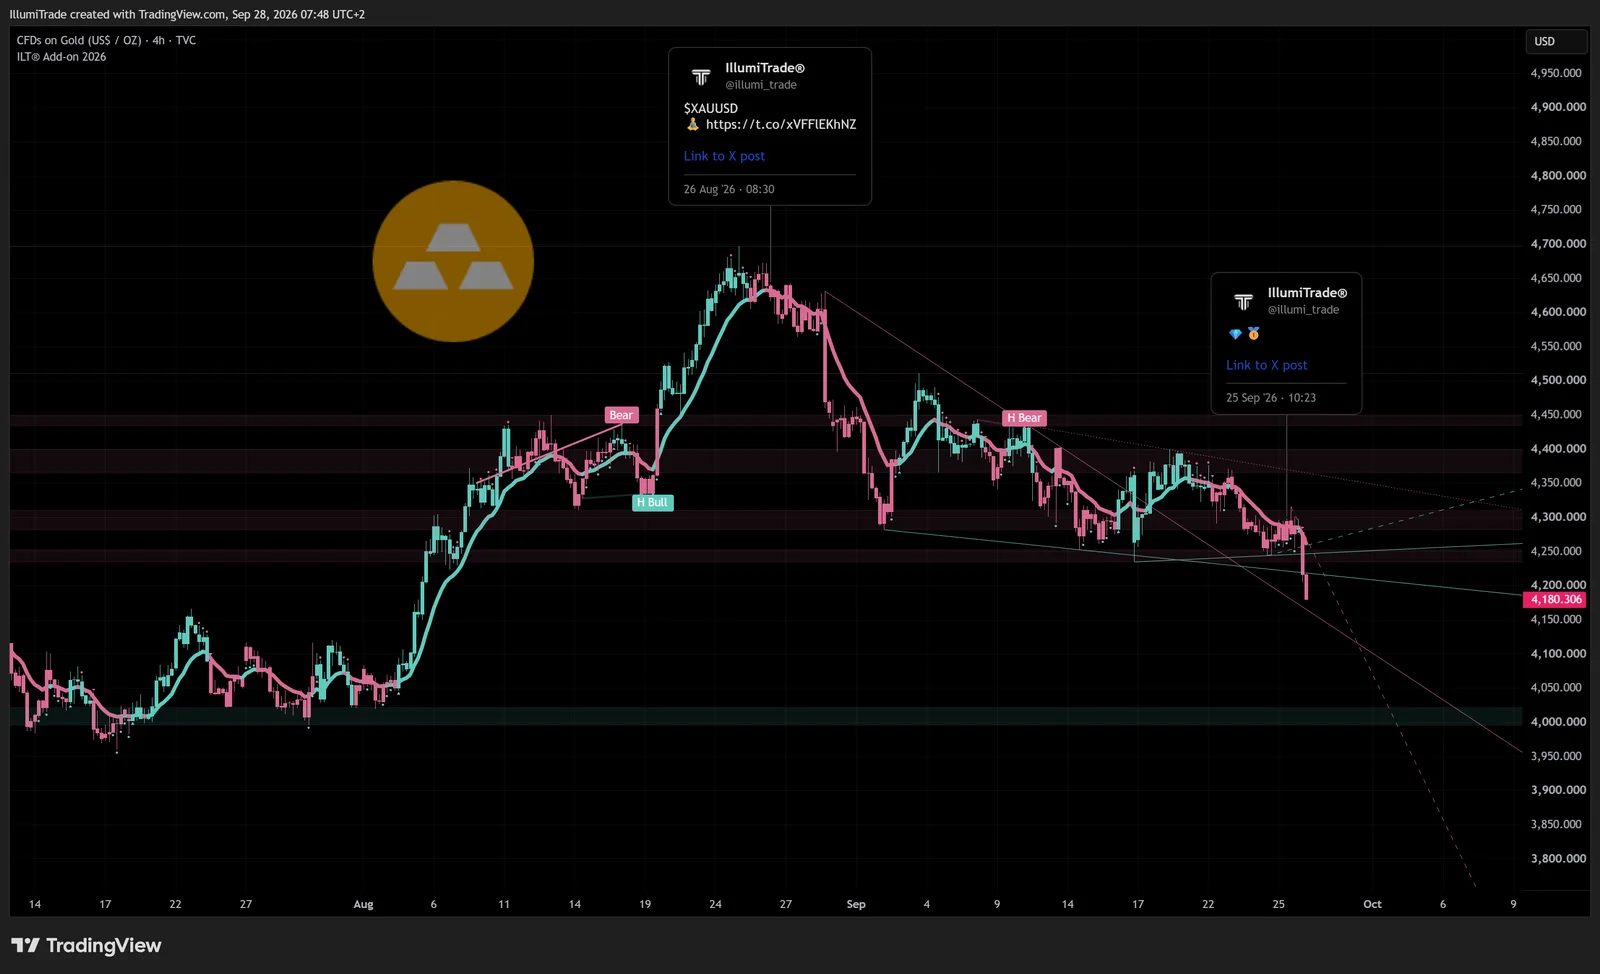
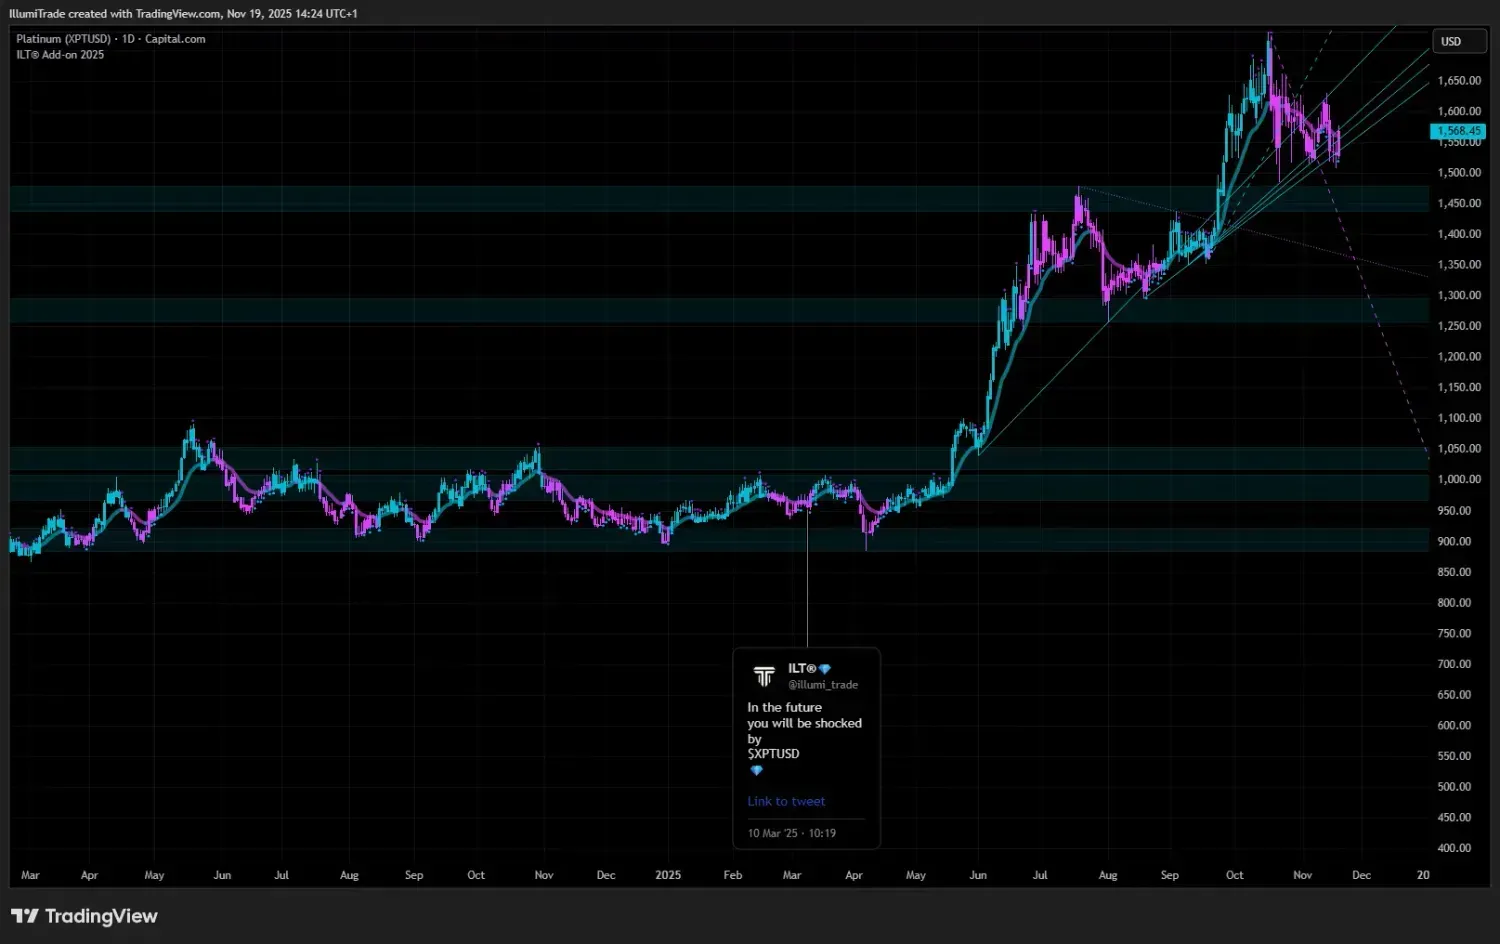
These are public calls, posted on X (@illumi_trade) with their timestamps — 300+ calls across 200+ markets. You can scroll back and check every one before you pay anything.
A simple gold workflow with ILT®
- On the daily chart, identify the trend with the Bull / Bear labels — gold respects them.
- Watch for a Bear (or Bull) label at an auto-drawn zone near a new extreme, ideally with divergence.
- Time the entry on the 4-hour chart; a Diamond there adds confirmation.
- Keep a dollar-index chart open: a gold signal that agrees with a dollar turn is stronger.
- Use the next zone as your objective and set alerts so a rate decision doesn't catch you away from the screen.
The macro side: for a daily, plain-English read on where gold lean over the next month, see our sister desk, ILT Oracle: Gold price forecast — next-month odds, updated daily →
See the Diamond on your own Gold charts
7 days free. Add your TradingView username, get access within hours, cancel in 1 click. The free TradingView plan is enough.
Start 7-Day Free Trial →Trading involves substantial risk of loss. Nothing on this page is investment advice. Public calls are shown as examples of how the suite reads a chart; past calls do not guarantee future results.
FAQ
What is the best indicator for gold on TradingView?
For XAUUSD, the most useful indicators combine trend structure, divergence at the extremes and clear support/resistance zones, because gold trends for long periods and turns sharply. The ILT® suite combines all three and called the August 2026 gold top near $4,650 publicly on X.
Is RSI good for gold?
RSI is useful for spotting divergence at major highs and lows, but on its own it stays overbought for long stretches in a gold uptrend. Use it for divergence, not for overbought/oversold signals.
What timeframe is best for trading gold?
The daily chart for trend context and the 4-hour chart for timing work well for swing trades. Intraday traders often use the 15-minute or 1-hour chart, with the 4-hour as a filter.