Best TradingView Indicator for Oil (WTI & Brent) in 2026
Oil reacts to headlines — supply decisions, sanctions, conflict — and gaps through levels that held for weeks. You can't predict the headline, but you can see when the chart is coiled tight enough that any headline will move it hard.
The short version: For crude, focus on compression (oil's biggest moves come out of tight ranges), divergence at the extremes and zones. The ILT® suite printed the Diamond at the April 2026 oil top before a ~17 point drop, and flagged Brent hours before a +4% breakout in October — both posted publicly.
What makes an indicator good for oil
- It must read the coil before the headline. When oil compresses, the next headline sets the direction and the move is large. Seeing the coil is what lets you be ready.
- It must survive gaps. Oil gaps over weekends and on news. Zones and alerts work better than tight indicator crossovers that break on every gap.
- It must mark exhaustion. Oil spikes on fear and often reverses fast; divergence at the high is the warning.
- It must work on WTI, Brent and energy stocks. Many traders trade the commodity and the producers. One consistent read across both helps.
Free tools worth keeping
Free tools that help on oil: volume profile for the price areas crude respects, ATR for sizing stops to oil's volatility, and the RSI for divergence at the spikes.
How the ILT® suite reads oil
The ILT® suite measures compression on the chart, labels structure with Bull / Bear, draws zones and trendlines automatically and prints the Diamond when they line up. On oil, that combination caught both a major top in April 2026 and the setup ahead of the October Brent breakout.

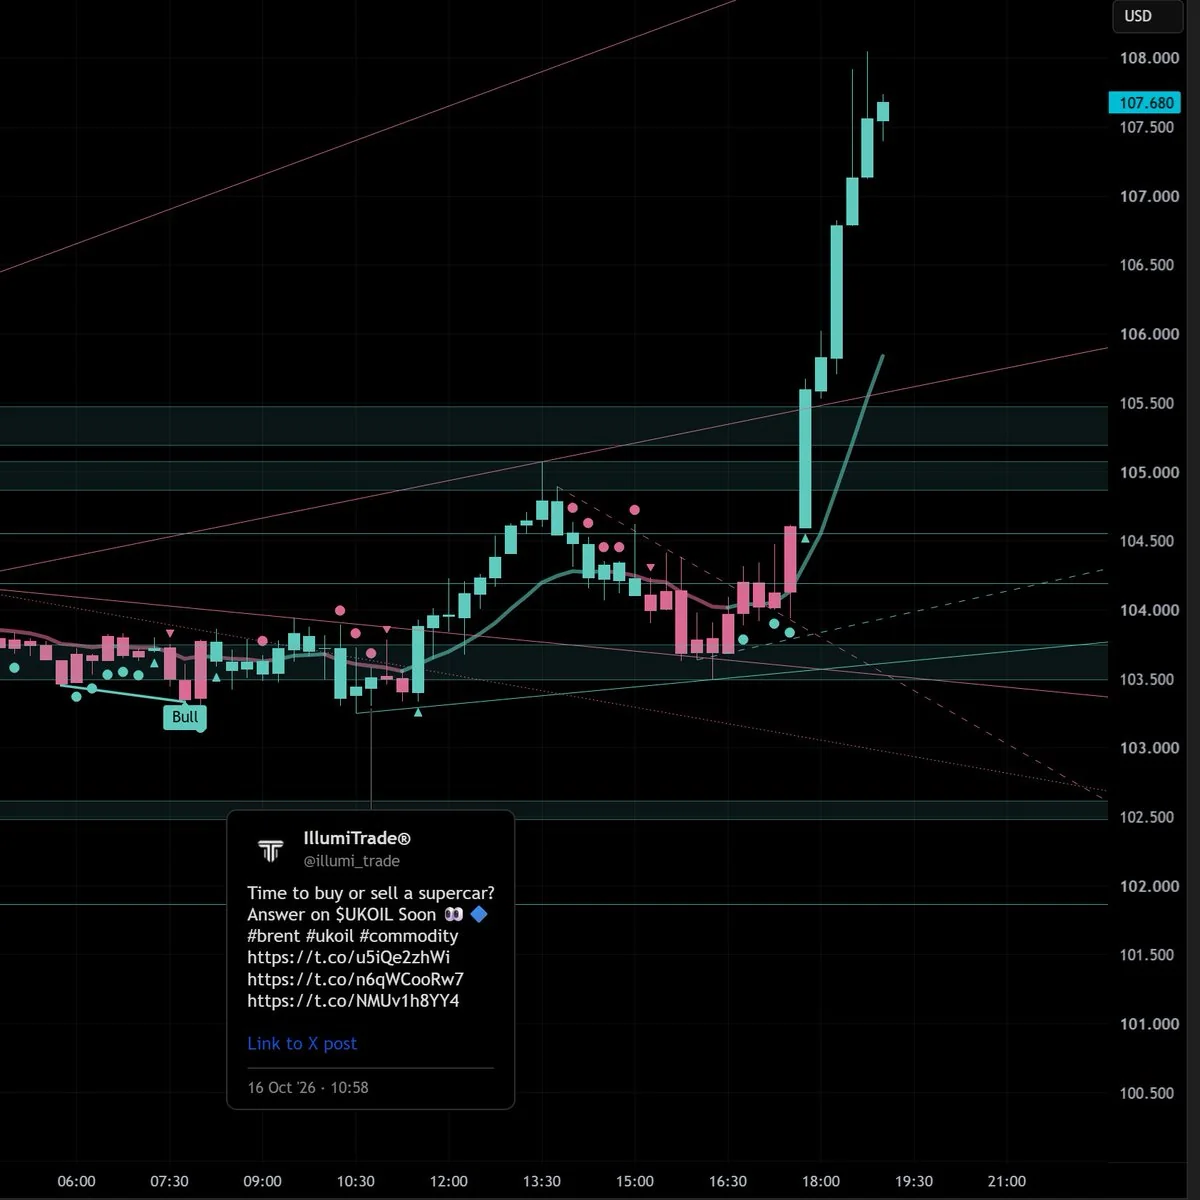
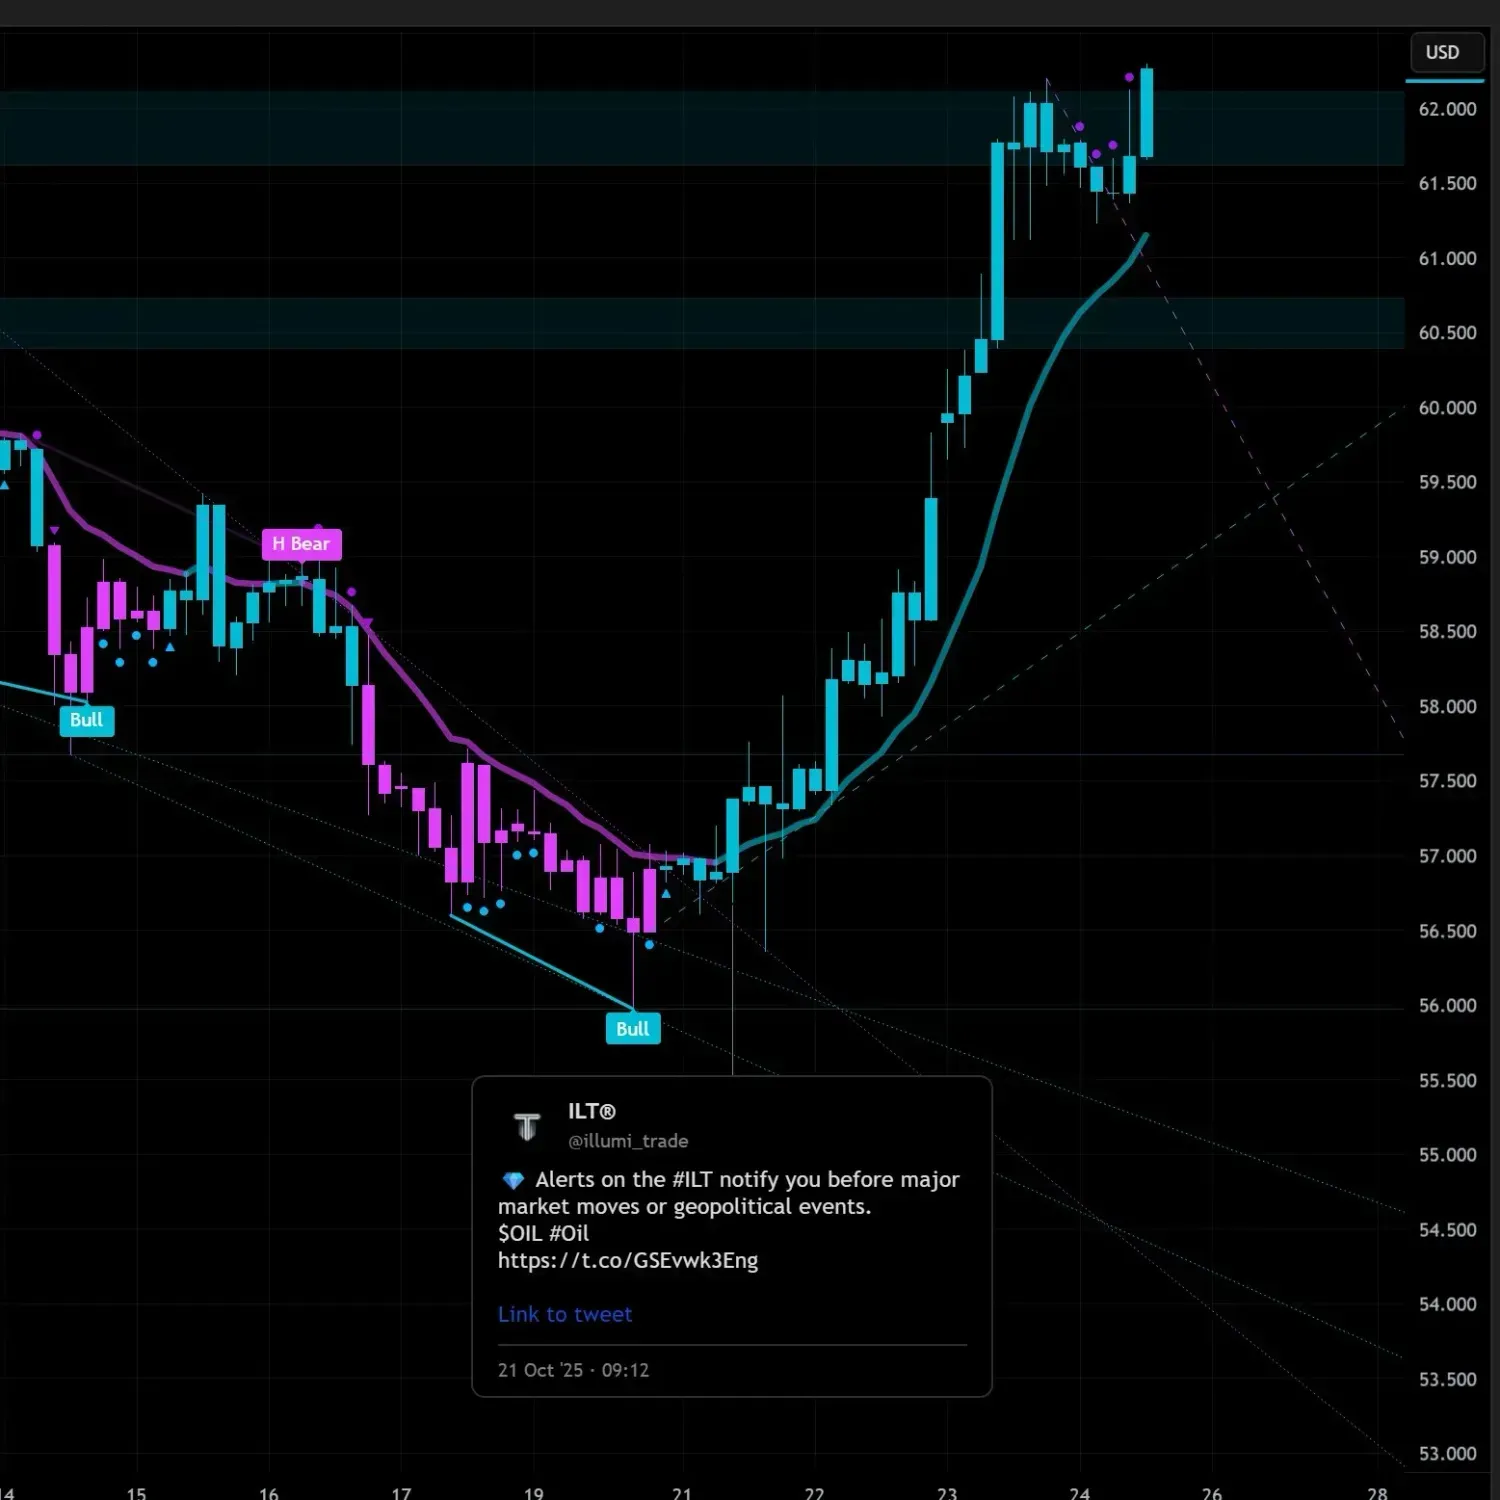
These are public calls, posted on X (@illumi_trade) with their timestamps — 300+ calls across 200+ markets. You can scroll back and check every one before you pay anything.
A simple oil workflow with ILT®
- On the daily chart, look for compression: the tighter oil coils, the bigger the eventual move.
- Mark the auto-drawn zones above and below — those are the likely targets once it breaks.
- Wait for the Diamond or a Bull / Bear label at a zone for direction.
- Size with oil's volatility in mind; gaps are part of the game.
- Set alerts before weekends and scheduled supply decisions.
The macro side: for a daily, plain-English read on where oil lean over the next month, see our sister desk, ILT Oracle: Oil price forecast — next-month odds, updated daily →
See the Diamond on your own Oil charts
7 days free. Add your TradingView username, get access within hours, cancel in 1 click. The free TradingView plan is enough.
Start 7-Day Free Trial →Trading involves substantial risk of loss. Nothing on this page is investment advice. Public calls are shown as examples of how the suite reads a chart; past calls do not guarantee future results.
FAQ
What is the best indicator for crude oil on TradingView?
Oil's biggest moves come out of tight ranges and are triggered by headlines, so the most useful indicators measure compression and mark the zones the move is likely to reach. The ILT® suite does both and flagged the April 2026 oil top and an October 2026 Brent breakout publicly.
Is the indicator the same for WTI and Brent?
Yes. The ILT® suite runs on any TradingView symbol — WTI, Brent, oil futures, energy ETFs and oil stocks.
What timeframe works best for oil?
Daily for compression and zones, 4-hour for timing. Intraday traders can go lower, keeping the 4-hour as a filter.