Best TradingView Indicator for Stocks & Indices (2026)
Stocks gap on earnings, drift on news and trend for quarters. The best indicator for them doesn't try to predict earnings — it shows you where a stock is stretched, where it's coiled, and where the next level sits.
The short version: For stocks and indices, combine structure (Bull / Bear turns), divergence at the extremes, compression before the breakout and clear zones. The ILT® suite does all four on any stock, ETF or index — 12 months of JPMorgan tops and bottoms are a good example.
What makes an indicator good for stocks
- It must work across thousands of tickers. You need the same read on a mega-cap, a small-cap and an index — no per-ticker tuning.
- It must handle earnings gaps. Zones that survive gaps beat crossovers that break on every open.
- It must mark tops and bottoms, not just trend. Most stock indicators are trend-followers. Catching the turn is where the edge is.
- It must scale to a watchlist. Alerts on every symbol, so the chart comes to you.
Free tools worth keeping
Free tools still matter on stocks: volume to confirm breakouts, the 50- and 200-day averages for trend context, RSI divergence at the extremes, and the VIX as a read on market fear.
How the ILT® suite reads stocks
The ILT® suite reads any stock, ETF or index the same way: Bull / Bear labels at structure turns, H Bull / H Bear for hidden divergences inside a trend, auto-drawn zones and trendlines, and the Diamond when compression and confluence line up. It works on US stocks, European banks, Asian indices and volatility itself.
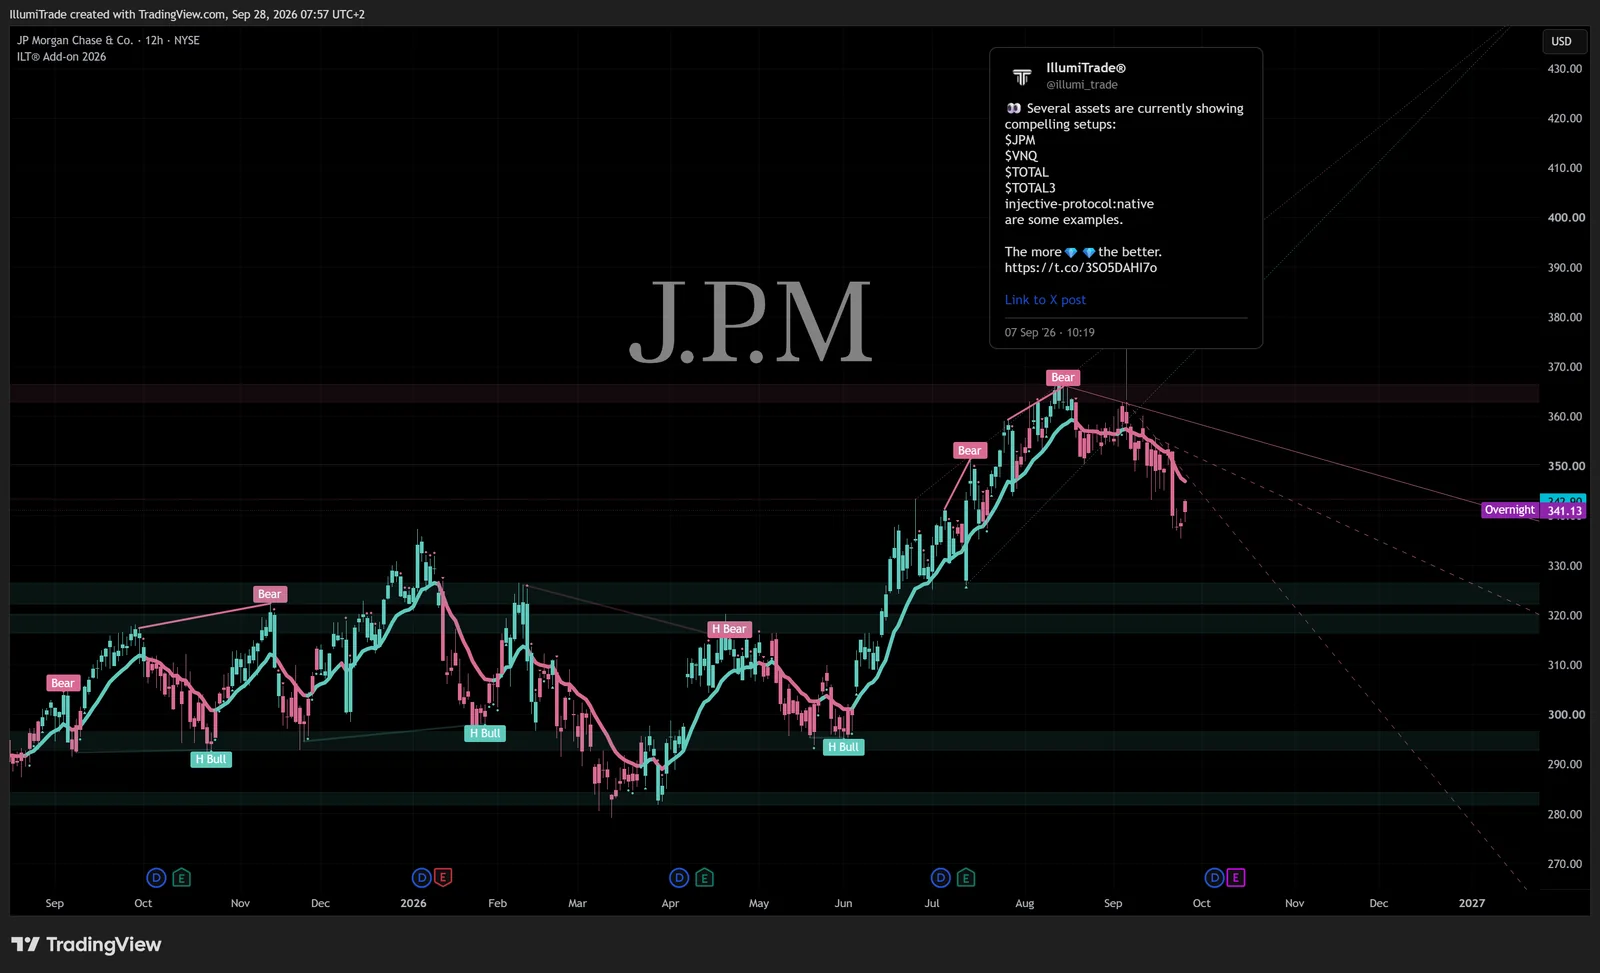
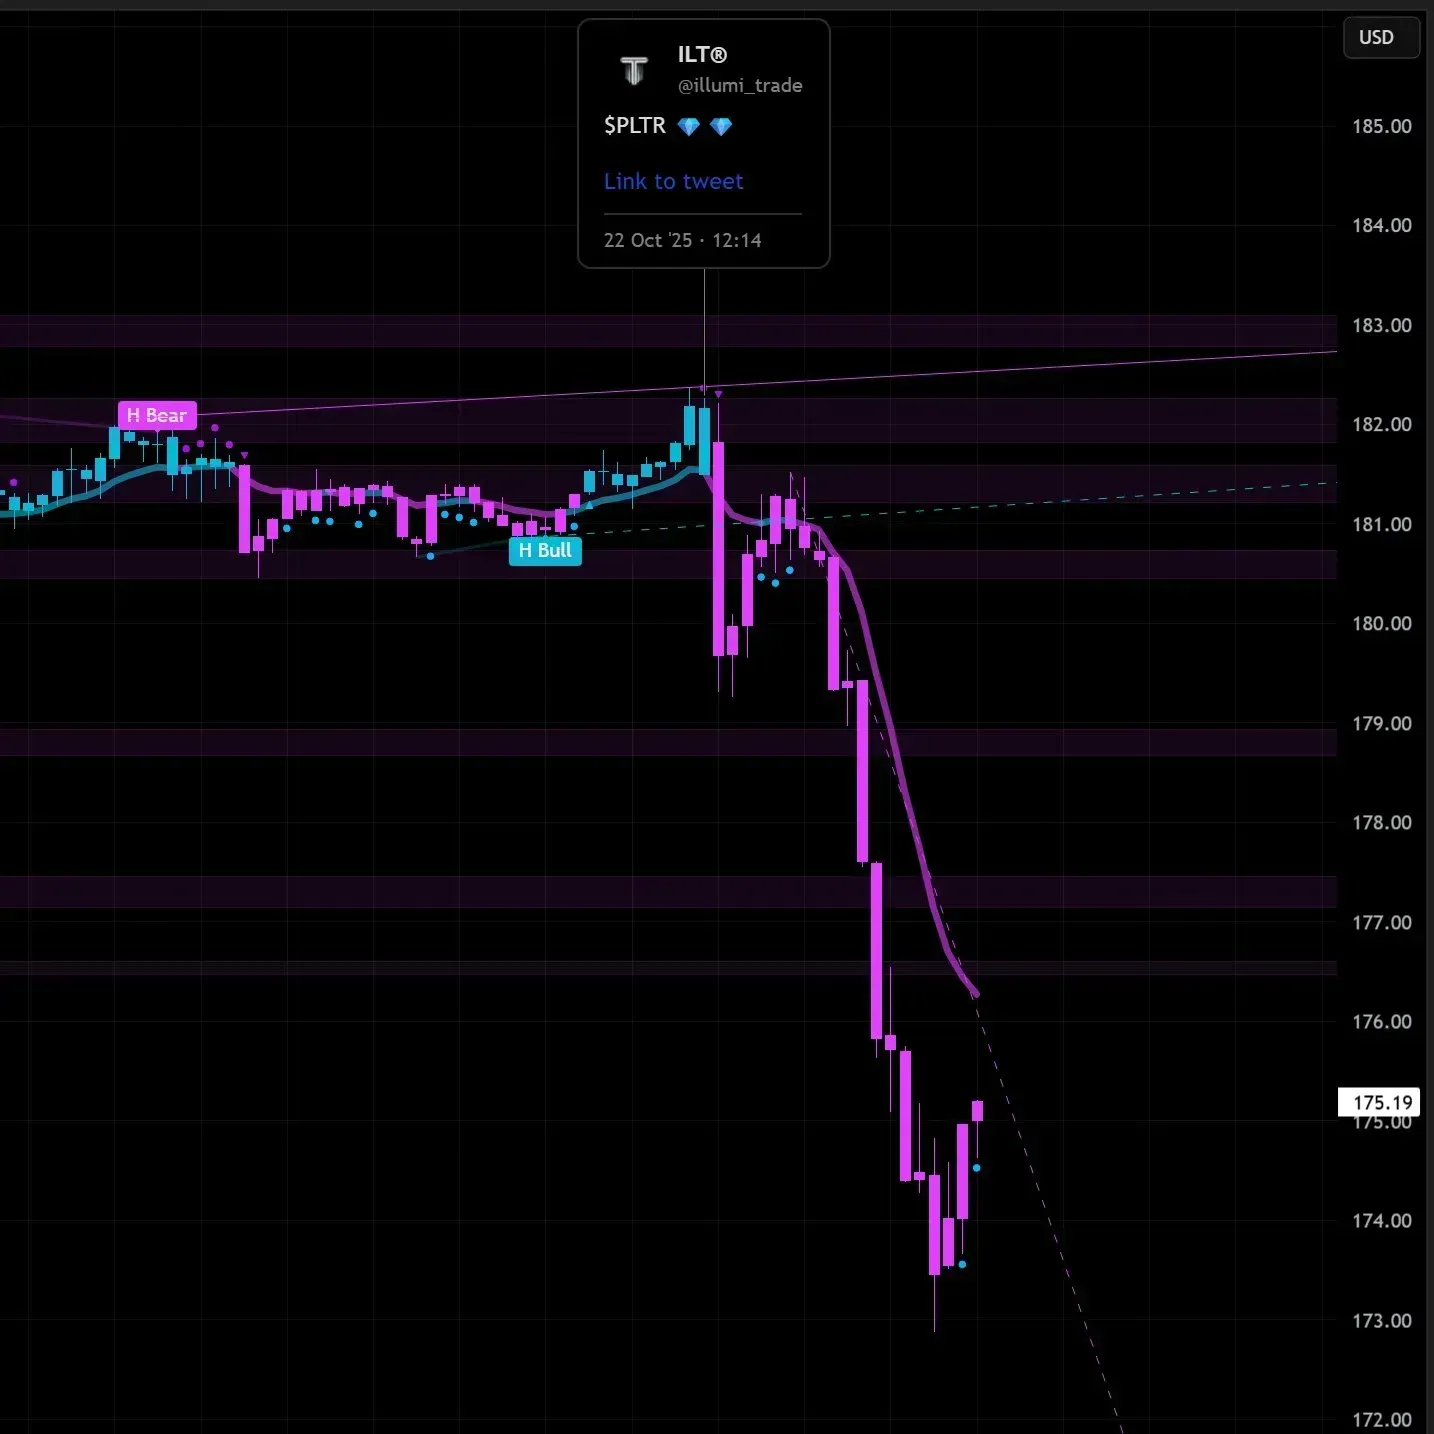
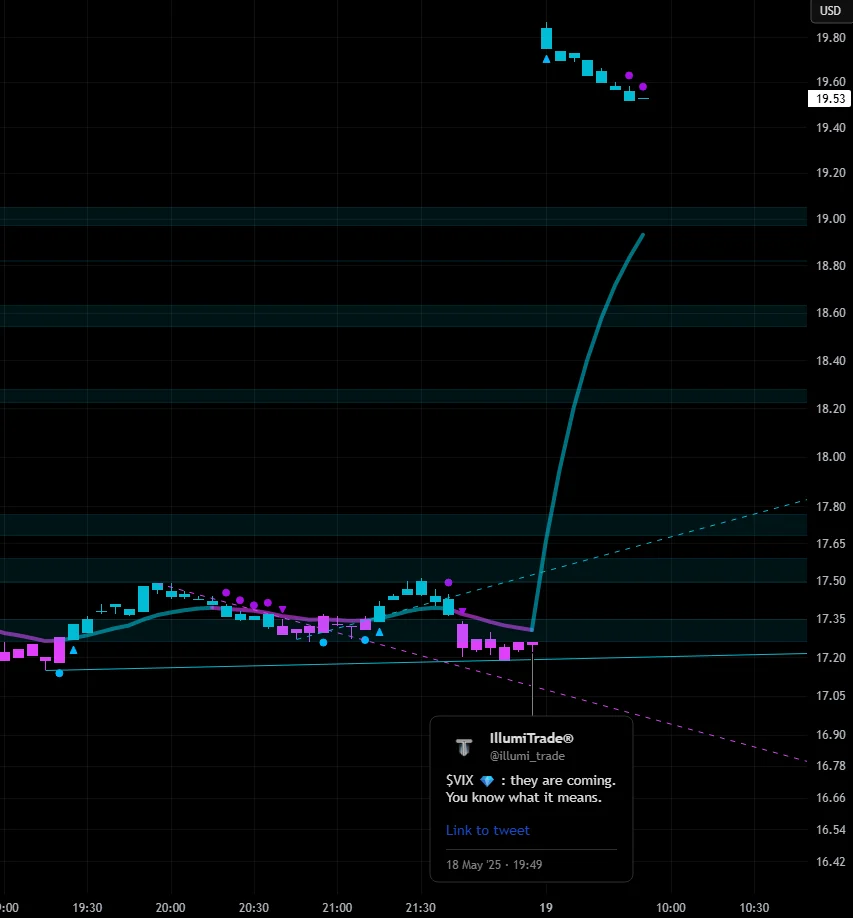
These are public calls, posted on X (@illumi_trade) with their timestamps — 300+ calls across 200+ markets. You can scroll back and check every one before you pay anything.
A simple stocks workflow with ILT®
- Start with the index (S&P 500, Nasdaq, Hang Seng): most stocks follow it.
- Check the VIX — a Diamond on volatility has often come before sharp market moves.
- On the stock, look for a Bull or Bear label at an auto-drawn zone, ideally with divergence.
- Avoid entering right before earnings unless you accept the gap risk.
- Put alerts on your watchlist so setups come to you.
The macro side: for a daily, plain-English read on where stocks lean over the next month, see our sister desk, ILT Oracle: S&P 500 forecast — next-month odds, updated daily →
See the Diamond on your own Stocks charts
7 days free. Add your TradingView username, get access within hours, cancel in 1 click. The free TradingView plan is enough.
Start 7-Day Free Trial →Trading involves substantial risk of loss. Nothing on this page is investment advice. Public calls are shown as examples of how the suite reads a chart; past calls do not guarantee future results.
FAQ
What is the best indicator for stocks on TradingView?
The most useful stock indicators combine trend structure, divergence at the extremes and clear support/resistance zones, so you see both the trend and the turn. The ILT® suite does this on any stock, ETF or index, with alerts across a whole watchlist.
Does the ILT suite work on indices and ETFs?
Yes — any TradingView symbol, including the S&P 500, Nasdaq, Hang Seng, sector ETFs and the VIX.
Can I use it for day trading stocks?
Yes, it works on any timeframe. Day traders typically use the 5- to 15-minute chart for entries with the 1-hour or 4-hour chart as a filter.