Best TradingView Indicators 2026: How to Predict Market Moves Before They Happen
If you're trading Bitcoin, crypto, forex, or stocks in 2026, you need more than basic indicators. The market moves faster than ever, and by the time you see a trend on RSI or MACD, you're already late to the trade.
This guide breaks down the most accurate TradingView indicators for 2026, focusing on tools that predict major moves before they happen — not just confirm what already occurred.
Why Most TradingView Indicators Fail Traders
Here's the problem: most indicators are lagging. RSI, MACD, Moving Averages — they all show you what the market did, not what it's about to do.
By the time RSI hits 70 (overbought), Bitcoin could have already pumped 15% and be ready to dump. You're entering at the peak, not the bottom.
The best TradingView indicators for 2026 focus on leading signals — early warnings that catch compression zones, divergences, and momentum shifts before the big move happens.
What Makes a TradingView Indicator "Good" in 2026?
A high-quality trading indicator should have these characteristics:
- Leading signals — alerts you BEFORE the move, not after
- Low false positives — fewer fake-outs, higher accuracy
- Multi-timeframe confirmation — works across 15m, 4H, Daily charts
- Works on all assets — crypto, forex, stocks, commodities
- Divergence detection — catches hidden momentum shifts
- Compression alerts — identifies breakout zones before they explode
Top TradingView Indicators for 2026
1. Diamond Alert Indicators (Compression Detection)
The best indicators in 2026 use compression detection — they identify when the market is squeezing into a tight range, about to explode in either direction. These are called "diamond alerts" because they signal high-probability setups.
How it works: When volatility contracts and price action tightens, the indicator fires a diamond alert. Historically, these alerts have preceded the biggest moves — both pumps and dumps.
Best for: Bitcoin, Ethereum, high-volatility altcoins, forex pairs during consolidation
2. Divergence Indicators (Hidden Momentum Shifts)
Divergence is when price makes a new high (or low) but the indicator doesn't — signaling weakening momentum. This predicts reversals before they happen.
Types of divergences to watch:
- Bullish divergence — Price makes lower lows, indicator makes higher lows → Reversal up
- Bearish divergence — Price makes higher highs, indicator makes lower highs → Reversal down
- Hidden divergence — Signals trend continuation instead of reversal
The ILT Indicator automatically detects all types of divergences and fires alerts before the reversal completes.
3. Multi-Timeframe Oscillators (Confluence Scoring)
Single-timeframe indicators miss the bigger picture. The best setups happen when multiple timeframes align — 15m, 1H, 4H, Daily all showing the same signal.
Multi-timeframe oscillators scan across 5-10 timeframes simultaneously and give you a confluence score (e.g., 9/10 timeframes bullish = high-probability long).
4. Volume + Price Action Confirmation
Price can lie. Volume doesn't. The strongest TradingView setups combine price action with volume spikes to confirm breakouts are real, not fake-outs.
Look for indicators that overlay volume analysis on top of momentum signals — if price breaks out but volume is weak, it's a trap.
How to Use TradingView Indicators for Maximum Profit
Having the right indicator is step one. Here's how to actually use it:
- Wait for confluence — Don't trade on a single signal. Wait for 2-3 confirmations (e.g., diamond alert + divergence + volume spike)
- Use multi-timeframe analysis — Check if the setup works on both 15m and Daily. If yes, it's stronger
- Set alerts, don't stare at charts — Let the indicator notify you when setups appear. No need to watch candles 24/7
- Backtest before going live — Run the indicator on historical data. Does it catch the big moves? Low false positives?
- Risk management always — Even the best indicator won't be 100% accurate. Use stop losses
What a good signal looks like on a real chart
Any list of indicators is easier to judge against dated examples. These are public calls made with the ILT® suite on three different markets. They are selected examples, not a full record, and some setups fail: always use a stop.
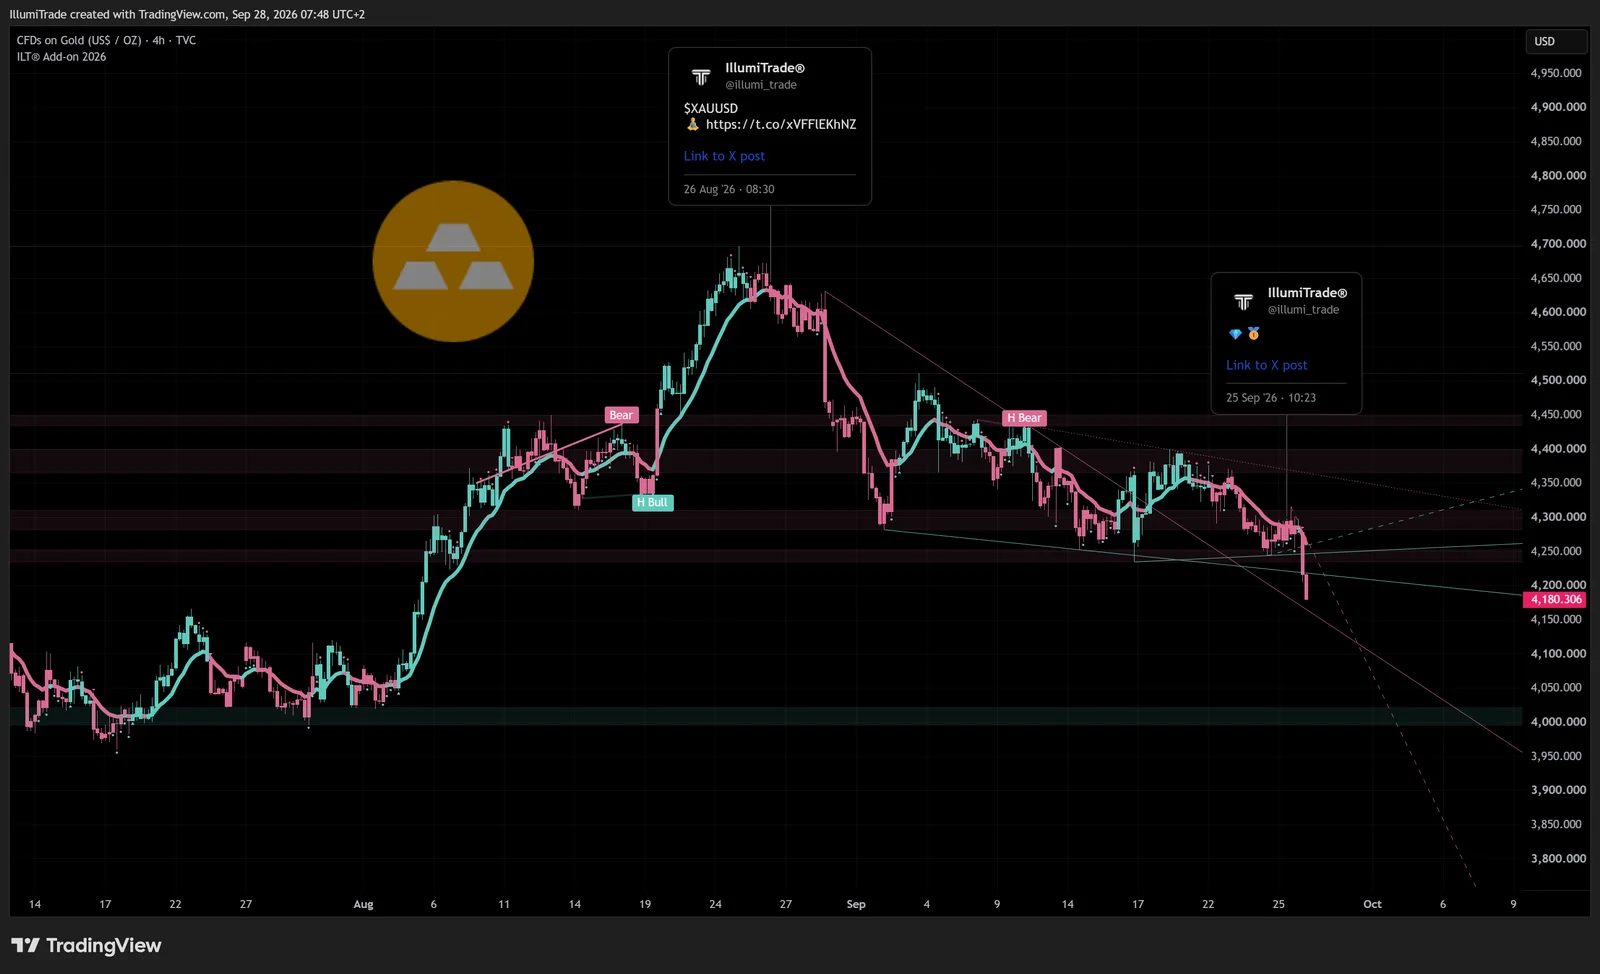
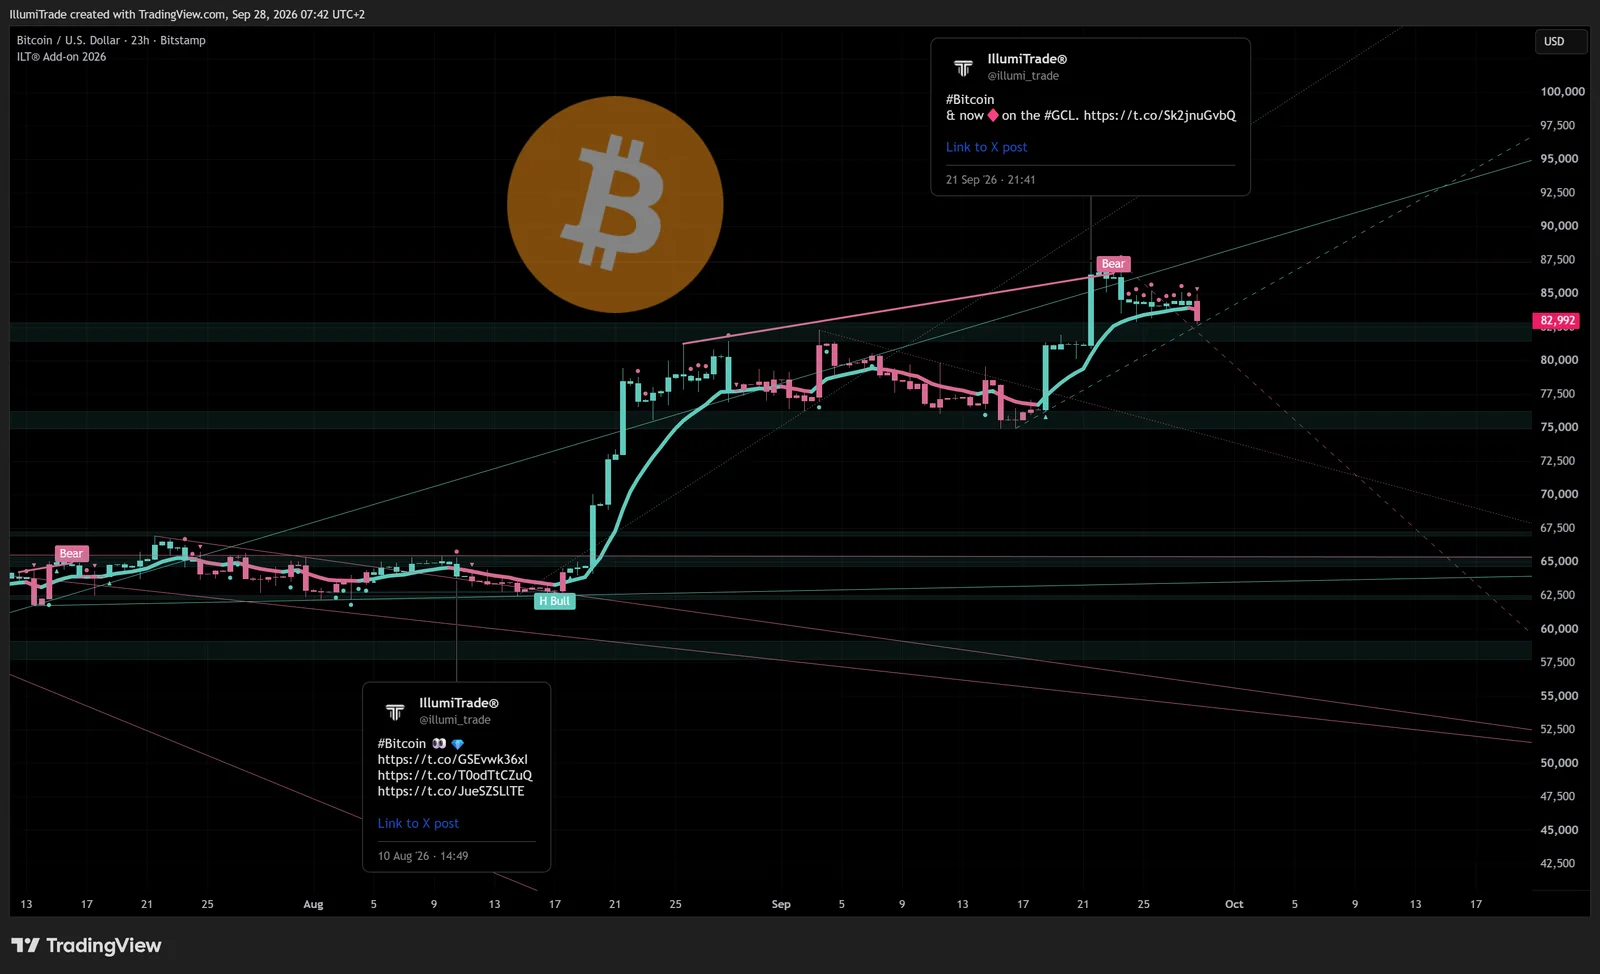
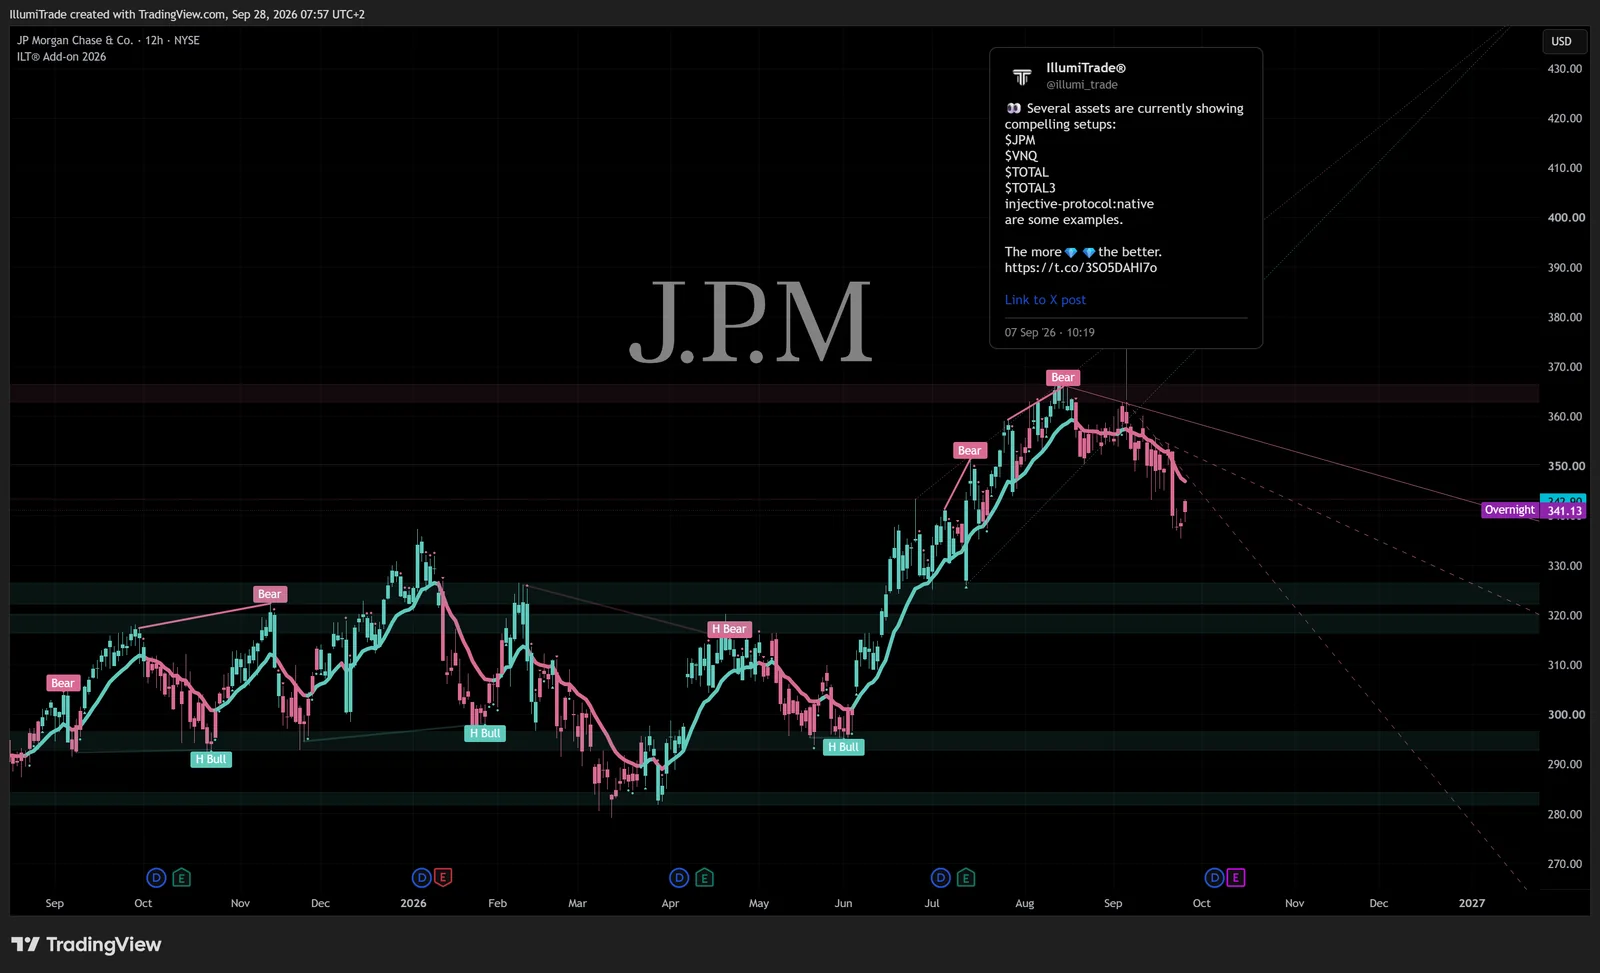
Selected public calls from @illumi_trade. Trading involves risk of loss; past performance is not indicative of future results. Nothing here is investment advice.
When you compare indicators, ask each vendor for dated, public examples like these, with the losing ones included. If you want to see how ours differ from other popular suites, read our comparisons with LuxAlgo, Market Cipher, AlgoAlpha and ChartPrime, or see the best setup for your market on our market guides.
Want the Indicator That Predicted These Moves?
The ILT® Indicator uses diamond alerts + divergence detection + multi-timeframe confluence to predict major Bitcoin, crypto, forex, and stock moves before they happen.
4-year verified track record · Used by 430+ traders · Works on all TradingView assets
→ Get ILT Indicator — $80/MonthCommon Mistakes When Using TradingView Indicators
Mistake #1: Using too many indicators at once
More indicators ≠ better accuracy. If you have 10 indicators on your chart, you'll get conflicting signals and analysis paralysis. Stick to 1-2 high-quality indicators.
Mistake #2: Ignoring timeframe context
A bullish signal on the 5-minute chart means nothing if the Daily is bearish. Always check higher timeframes for context.
Mistake #3: Chasing every signal
Not every alert is a trade. The best traders wait for A+ setups — multiple confirmations, clean chart structure, strong volume.
Mistake #4: Not backtesting
Before risking real money, run the indicator on past data. Does it actually catch the big moves? How many false signals does it give?
Which TradingView Indicator Should You Use in 2026?
If you're serious about trading, you need an indicator that:
- Alerts you BEFORE major moves (not after)
- Works across crypto, forex, stocks, commodities
- Has a proven track record (not just backtested, but real verified results)
- Combines compression detection + divergence + multi-timeframe analysis
The IllumiTrade ILT® Indicator checks all these boxes. It's been used by 430+ traders since 2021, with verified results including:
- Bitcoin top called at $69k before the dump to $58k
- 20-day winning streaks reported by users
- 401% portfolio gains, 15x account growth, $63k+ profit from single users
You can see all the verified proof screenshots here.
Conclusion: The Future of TradingView Indicators
The best TradingView indicators in 2026 aren't just technical overlays — they're predictive systems that combine compression detection, divergence analysis, and multi-timeframe confluence to catch major moves before they happen.
If you're still using RSI and MACD alone, you're trading with 2015 tools in a 2026 market. Upgrade your edge.
Get the 3-Setup Playbook (free PDF)
The exact compression, divergence & reversal setups behind our flagged $OIL, $BTC and $VIX calls — broken down step by step.
Get the Playbook →Instant access · No spam · Unsubscribe anytime
Ready to Level Up Your Trading?
Get access to the ILT® Indicator and start predicting market moves before they happen.
→ Start Now — $80/MonthCancel anytime · Works on all TradingView assets · 4-year verified track record